


CHRONOLOGICAL DISTRIBUTION OF THE COIN FINDS IN BULGARIA REPORTED IN THE SCIENTIFIC LITERATURE FOR A QUARTER CENTURY (1910–1934)
Jordan Tabov, Kliment Vasilev, Asen Velchev
(Institute of Mathematics and Informatics,
Bulgarian Academy of Sciences, Sofia)
CHRONOLOGICAL DISTRIBUTION OF THE COIN FINDS IN BULGARIA
REPORTED IN THE SCIENTIFIC LITERATURE
FOR A QUARTER CENTURY (1910–1934)
Abstract. We put together the data for coin finds, reported in the early Bulgarian archaeological journals
in the period 1910–1934. We suggest a method for constructing appropriate function of the chronological
distribution of coins. Its graph, obtained by standard computer software tools (Microsoft Excel), provides
a good visual presentation of the function. The method follows the ideas of the volume function
introduced by A. Fomenko. Our investigations show a large-scale anomaly: the too large percent coins in
a quite distant from us epoch – the period (–200, 370) and the unacceptably small, practically insignificant
percent coins during the following, later interval (370; 970).
Key words: digitization, coin finds, chronological distribution.
1. Introduction
The old coins, found in any country, are important information source about the past of
this country. Conclusions can be made about the economy status of its population, trade
relations, religion, about the names and the titles of the respective rulers, etc. in different
historical periods. The coins are sometimes also a “dating” element of linked archaeological
monuments. Therefore the coin finds are an object of attention both for archaeologists
and historians. The presentation of the quantities and dating of all excavated in
a given region coins can be (in our view) a basic element in investigations of the development
of the respective region during different historical epochs. Surveys of this type
are rare; we should mention in Bulgarian historical publications the comprehensive article
of Zdravko Plyakov [8], devoted to coin finds in Bulgaria from the period of the 13th
and the 14th centuries.
Chronological distribution of the coins (CDC), for the coins described in [8], is
constructed and visualised via graph and then used for modelling of the monetary circulation
in Mediaeval Bulgaria in the articles [12] and [13]. C. Gazdac visualised quantitative
data on coin finds and their territorial distribution in [6]. The defining and using
chronological distributions have roots in A. Fomenko’s “volume function”, introduced
in [5] and [7]. Applications of “volume function” are described in details also in [11]–
[13], etc. J. Tabov suggested a generalization and some modifications of the concept
“volume function” in [11].
Jordan Tabov, Kliment Vasilev, Asen Velchev
104
2. Data description
In this paper we study the data about more than 150000 coins, called further “Data set
1910–1934”. We extracted it from all the publications in the specialised rubrics for
short messages on archaeological finds in the two Bulgarian archaeological periodicals
“Proceedings of the Bulgarian Archaeological Society” [10] (published since 1910 till
1920) and “Proceedings of the Bulgarian Archaeological Institute” [9], published since
1921 till now. We included the data for the 25 years period 1910–1934. Thus we use
scientifically verified information. We choose the earliest period of a systematical “scientific
publication” with plans to continue the “CDC constructing” adding to “Data set
1910–1934” periods after 1934.
Some of the data are described in the periodicals mentioned above for a bit different
purpose and they are not always complete from our viewpoint. Our methods demand
both the number of coins in every coin find and an accurate attribution of each
coin to the reign of a known ruler (or period). Therefore a small part of the data were
dropped out from our research, for example “Hisarlaka (Kyustendil) – dozens of coins
of Justin 1, Justinian 1 and other Byzantine coins (324–1460) and Serbian coins (1168–
1868)” from volume 1 of “Proceedings of the Bulgarian Archaeological Society” [10].
3. Description of the method
Basic time unit: twenty years. We fix periods like 1201–1220, 1221–1240 as time units.
In our earlier papers [12], [13] we used time units of 10 years. Our observations show
that the present interval of 20 years is more convenient, since the time for putting the
date in the computer is shorter. It is important to underline that the new unit of 20 years
is approximately equal to the averige duration of the reign of the kings, and therefore it
does not significantly influence the exactness of the results in comparison with the case
of using 10-year units.
Coins’ dating. Coins are usually related to the ruler stricken them. If a given coin is
Bulgarian, from tsar Ivan Alexander (1330–1371 г.), it is dated to the same period
namely: 1330-1371. This approach makes dating of the coins dependent on their minting.
“Round” periods of reign. Since we’ve chosen twenty-year period as a unit, we express
the intervals of reign via such units. The basic interval of Tsar Ivan Alexander is 1321–
1380. For Tsar Ivan Shishman (1371–1393) it is 1381–1400. The “rounding” of the
reign intervals we also apply to the respective coins’ intervals.
Note. For the sake of convenience we will further call a rounded (basic) interval just
“interval”. Each basic interval consists of an integer number of units.
Individual unit coin’s function (IUCF). To every coin we associate a function, equal to
1 in the “coin’s” interval, and to 0 out of it. For instance a coin, minted by Tsar Ivan
Shishman (1371–1393), is in the interval 1381–1400, which has a unit “length”. The
IUCF of this coin equals 1 in this interval and 0 out of it. The respective graph is presented
in Fig. 1.
Jordan Tabov, Kliment Vasilev, Asen Velchev
105
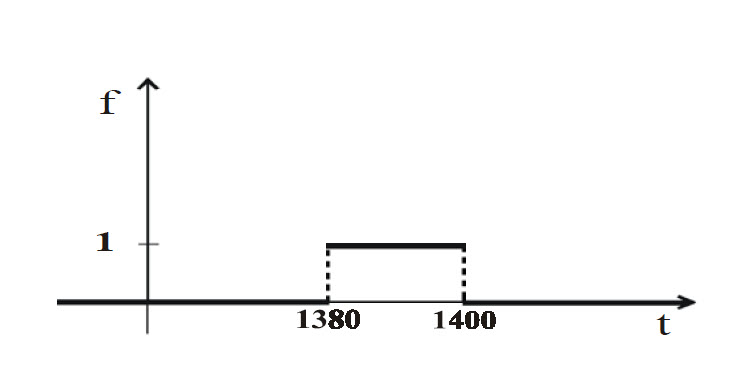
Fig. 1. IUCF of coin, struck by Tsar Ivan Shishman (1371–1393).
Chronological distribution of coins (CDC). The new function we obtain summing up
the IUCF of the coins from a given sample, multiplied in advance by calibration coefficient
(CC), equal to 60/n, where n is the number of units in the ruler’s interval. For example
a coin, struck by tsar Ivan Shishman (1371–1393), has a “rounded” (basic) interval
1381–1400. It includes one unit, therefore the CC equals to 60. Thus IUCF has to be
multiplied by 60 before summarizing. For the coins of Emperor John Palaeologus
(1341–1391) the interval is 1341–1400. It includes 3 time units, therefore CC is
60/3=20.
The role of CC. Let us consider the CDC of set of coins, which includes:
1. A coin struck by Tsar Mikhail Shishman (1323–1330);
2. A coin struck by Tsar Ivan Alexander (1330–1371).
Without the CC in CDC both the coins would have “contribution” of 1 for each time
unit. For the first coin this contribution is over the unit 1321–1340; for the second one it
is over three units, i.e., the total “contribution” of the second one is three times greater
than the “contribution” of the first coin. Introducing the CC in CDC guarantees multiplying
the IUCF of the second coin by a coefficient, 3 times smaller than the coefficient
of the first coin. I.e. CC establishes “equipollency” to all coins, no matter how long was
ruling the respective ruler. For the sake of convenience we use here the number 60 since
it is divisible by 2, 3, 4, 5 and 6, which effects on CC to be integer.
Chronological distribution of coins (CDC) has the property: its value on every
unit equals to the number of coins, struck during this unit, multiplied by 60. If the interval
of a ruler is several units “long”, we assume that his coins were minted constantly
during all of them).
4. CDC construction for “Data set 1910–1934”
It is obtained using electronic spreadsheet Microsoft Excel. Details of the respective
methods can be found in [12] and [13].
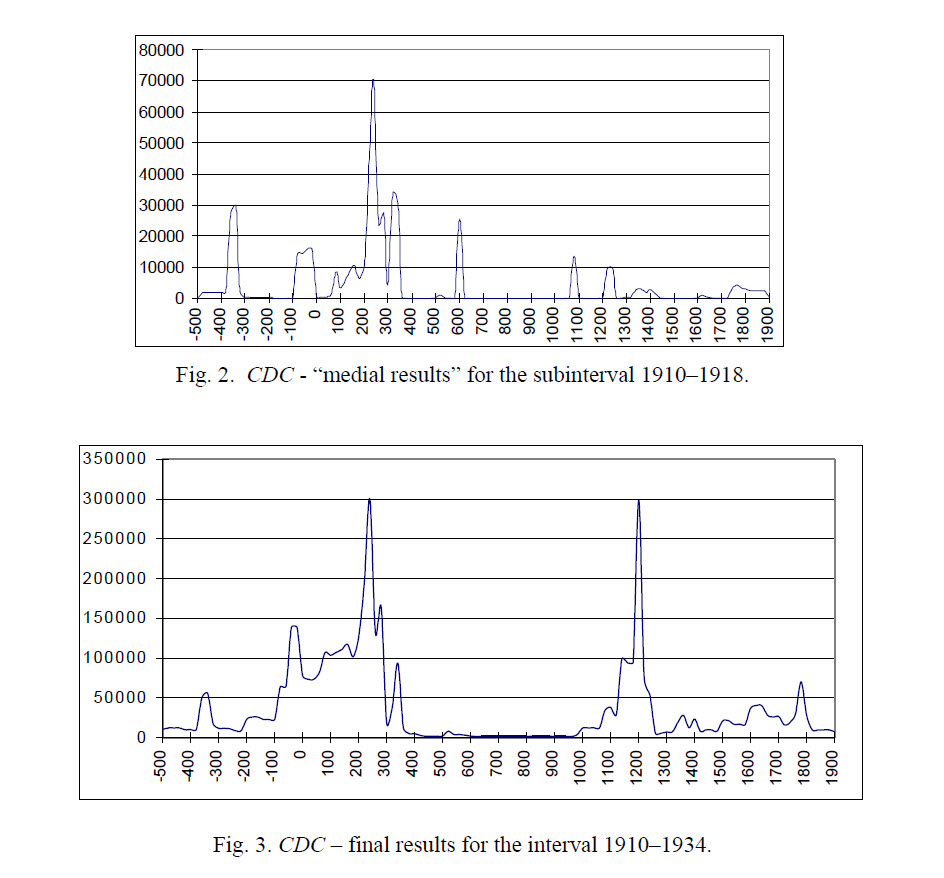
To keep the trace of the character of the changes of the function CDC when
“new” data is added to data set, we present “intermediate results”, obtained for a shorter
interval, gradually reaching the whole interval 1910–1934. The first stage is construction
of CDC for the subinterval 1910–1918 (Fig. 2). In Fig. 3 is shown the final CDC
for “Data set 1910–1934”.
5. Analyses and conclusions
The values of CDC shown in the above figures are approximately equal to 60 multiplied
by the number of the included in “Data set 1910–1934” coins, stricken during the respective
periods. Therefore to “high” graph on a given time unit corresponds a “large”
number of coins and respectively to “low” graph – “small” number.
We note that the number of coins vary for the different periods in very wide intervals.
Surprisingly about 2/3 of all the coins belong to the period (–200; 370), i.e. between
200 year BC and 370 year AC. In the following longer period (370; 970) there
are no coins practically. About 1/3 of the coins falls into the period (970; 1800). It is the
latest and longest one (twice the length of the previous ones). A maximum is reached in
it about 1200 year.
The analysis of the varying of CDC on the three graphs leads to the conclusion,
that there is a certain kind of stability with respect to the adding of new data. For instance
the high values of the graph of the CDC in the interval (–200, 370), as well as the
low values in the interval (400, 970) appear clearly in the first graph for the data from
1910 till 1918 (see Figure 2). It preserves its character in the graph for the data since
1910 till 1934 (Figure 3). On the basis of these observations we can expect that the form
of the graph will remain more or less the same if we include in our research the data not
only for all the coins, reported in the scientific literature, but for all the coins found in
Bulgaria.
This general view displays a large-scale anomaly: the too large percent coins in
a quite distant from us epoch – 2000 years ago and the unacceptably small, practically
insignificant percent coins during a following, later interval (370; 970). May we attach
it to eventual “dark ages”, caused by the invasions of the Goths, Huns, Slavs and Bulgarians?
Under the pressure of many facts the myth of the “dark ages” is abandoned by
most of the historians. Furthermore with the dark ages cannot be explained the insignificant
percent of coins during the first half of the 6th century, traditionally described as
an epoch of religious and economical flourishing of the Balkans, signed by the creation
of the famous Constantinople’s “St. Sofia”.
We suggest the following hypothesis: this anomaly can be caused by wrong attribution
and dating of some coins, and consequently of the related with them historical
persons and events.
References
[1] Fedorov V. V., A. T. Fomenko, Statistical Estimation of Chronological Nearness of Historical
Texts. Problems of Stochastic Models Stability, Proc. Sem. BNIISI, Moscow, 1983, 101–107. (In
Russian). (English translation: Fedorov V. V., A. T. Fomenko, Statistical Estimation of Chronological
Nearness of Historical Texts, Journal of Soviet Mathematics 32:6, (1986), 668–675.)
[2] Fomenko, A., New Experimental and Statistical Methods of Dating Ancient Events and Application
to the Global Chronology of the Ancient World, Preprint Gos. Kom. Telev. Radiovesht. 3672
(1981), B07201 (9/XI-81), Moscow (in Russian).
[3] Fomenko A., Information functions and related to them statistical laws, Abstracts of 3-rd Internat.
Vilnius Conf. in Probab. Theory and Math. Statistics. Vilnius, 1981. Vol. 2, 211–212. (In Russian).
[4] Fomenko, A., Methods of Statistical Analysis of Narrative Texts and Application to Chronology,
Publishing House of Moscow University, Moscow, 1990 (in Russian).
[5] Fomenko, A. and S. Rachev, Volume Functions of Historical Texts and The Amplitude Correlation
Principle, Computers and the Humanities 11 (1990), 187–206.
[6] Gazdac C., Apulum project (1998–2001) – the numismatic approach, http://www2.rz.huberlin.
de/winckelmann/schaefer_numismatik_index.html
[7] Kalashnikov, V., S. Rachev and A. Fomenko, New Methods of Comparing Volume Functions of
Historical Texts, Problems of Stochastic Models Stability. Proc. of the Seminar, BNIISI, (1986)
Moscow, 33–45 (in Russian).
[8] Plyakov Z., Coin finds from the ХІІІ–ХІV centuries as a source of information for the foreign trade
of the Mediaeval Bulgaria, Historical Review 3–4 (2002), 3 –74. (In Bulgarian).
[9] Proceedings of the Bulgarian Archaeological Institute, Volumes: 1 (1921–1922), 2 (1923–1924),
3 (1925), 4 (1926–1927), 5 (1928–1929), 6 (1930–1931), 7 (1932–1933), 8 (1934).
[10] Proceedings of the Bulgarian Archaeological Society, Volumes: 1 (1910), 2 (1911), 3 (1912–1913),
4 (1914), 5 and 6 (1915–1918), 7 (1919–1920).
[11] Tabov, J. Chronological Distribution of Information in Historical Texts, Computers and the Humanities,
24 (2003), 235–240.
[12] Tabov, J., K. Vasilev and A. Velchev, A mathematical model of monetary circulation in Medieval
Bulgaria, Storiadelmondo 2003, http://www.storiadelmondo.com/14/tabov.monetary.pdf
[13] Velchev A., J. Tabov and K. Vasilev, Modelling the dynamics of the coin circulation in the past on
the basis of coin finds, Historical Review (to appear, in Bulgarian).
[14] Tabov, J., K. Vasilev and A. Velchev, Mathematical modelling of monetary minting in Medieval
Bulgaria, NCD Review 4 (2004), 99–104